500 Scientists Infographic < Back to portfolio Project: 
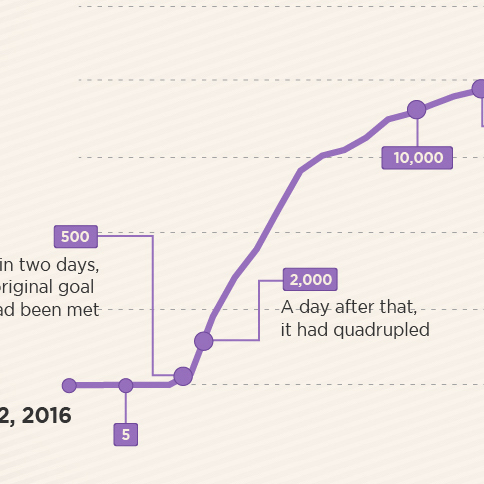
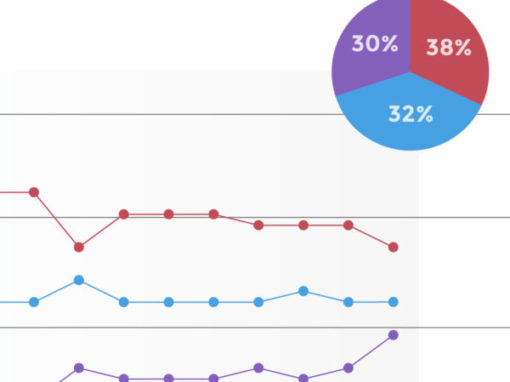
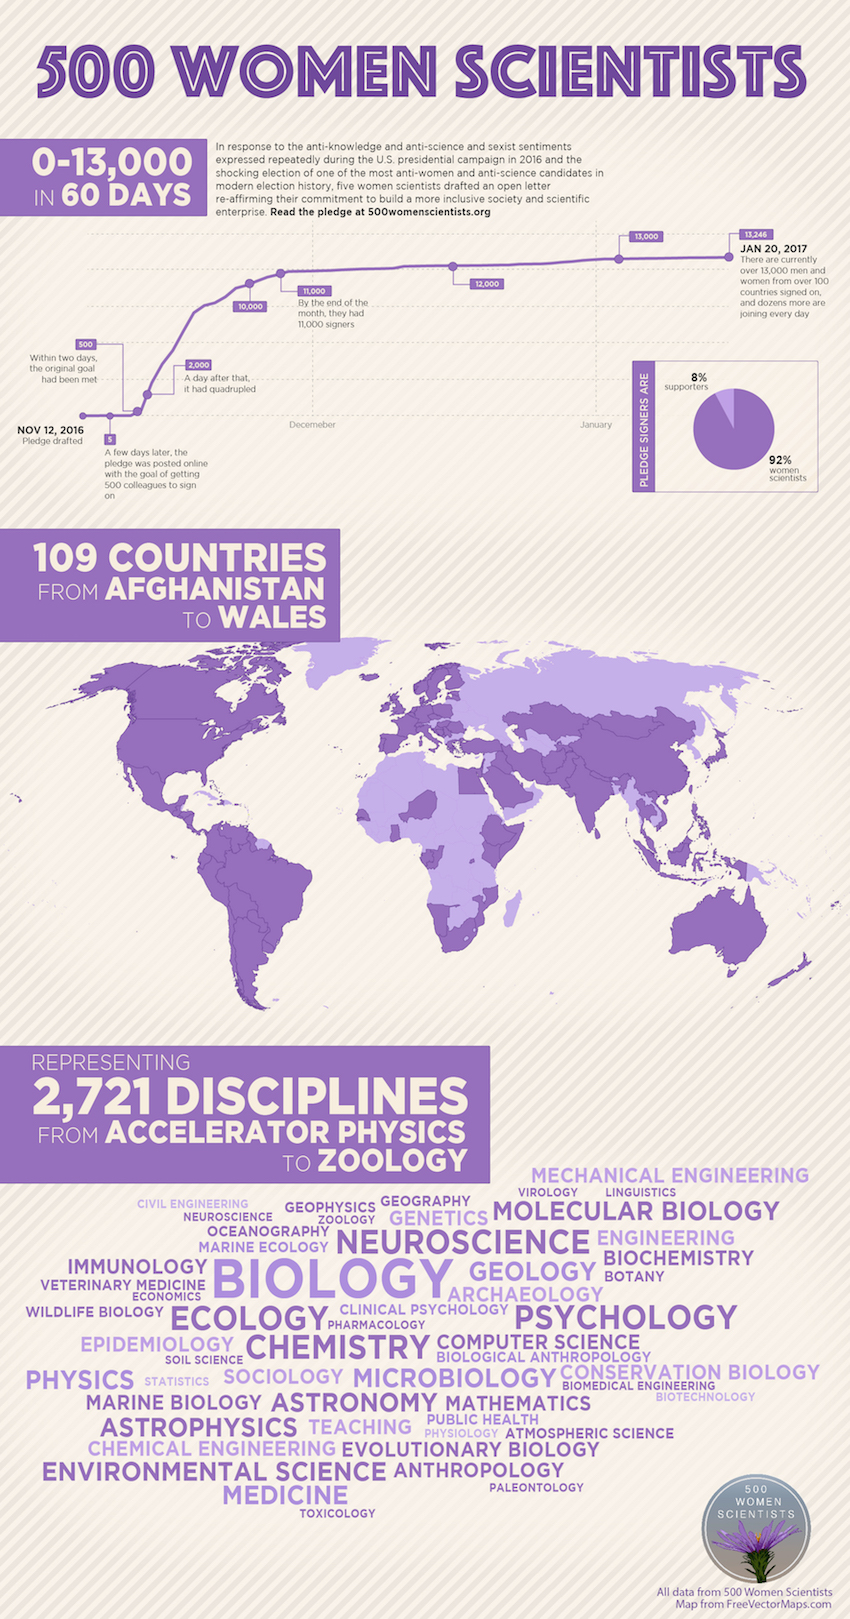
Infographics showing the genesis and growth of the 500 Women Scientists campaign. 
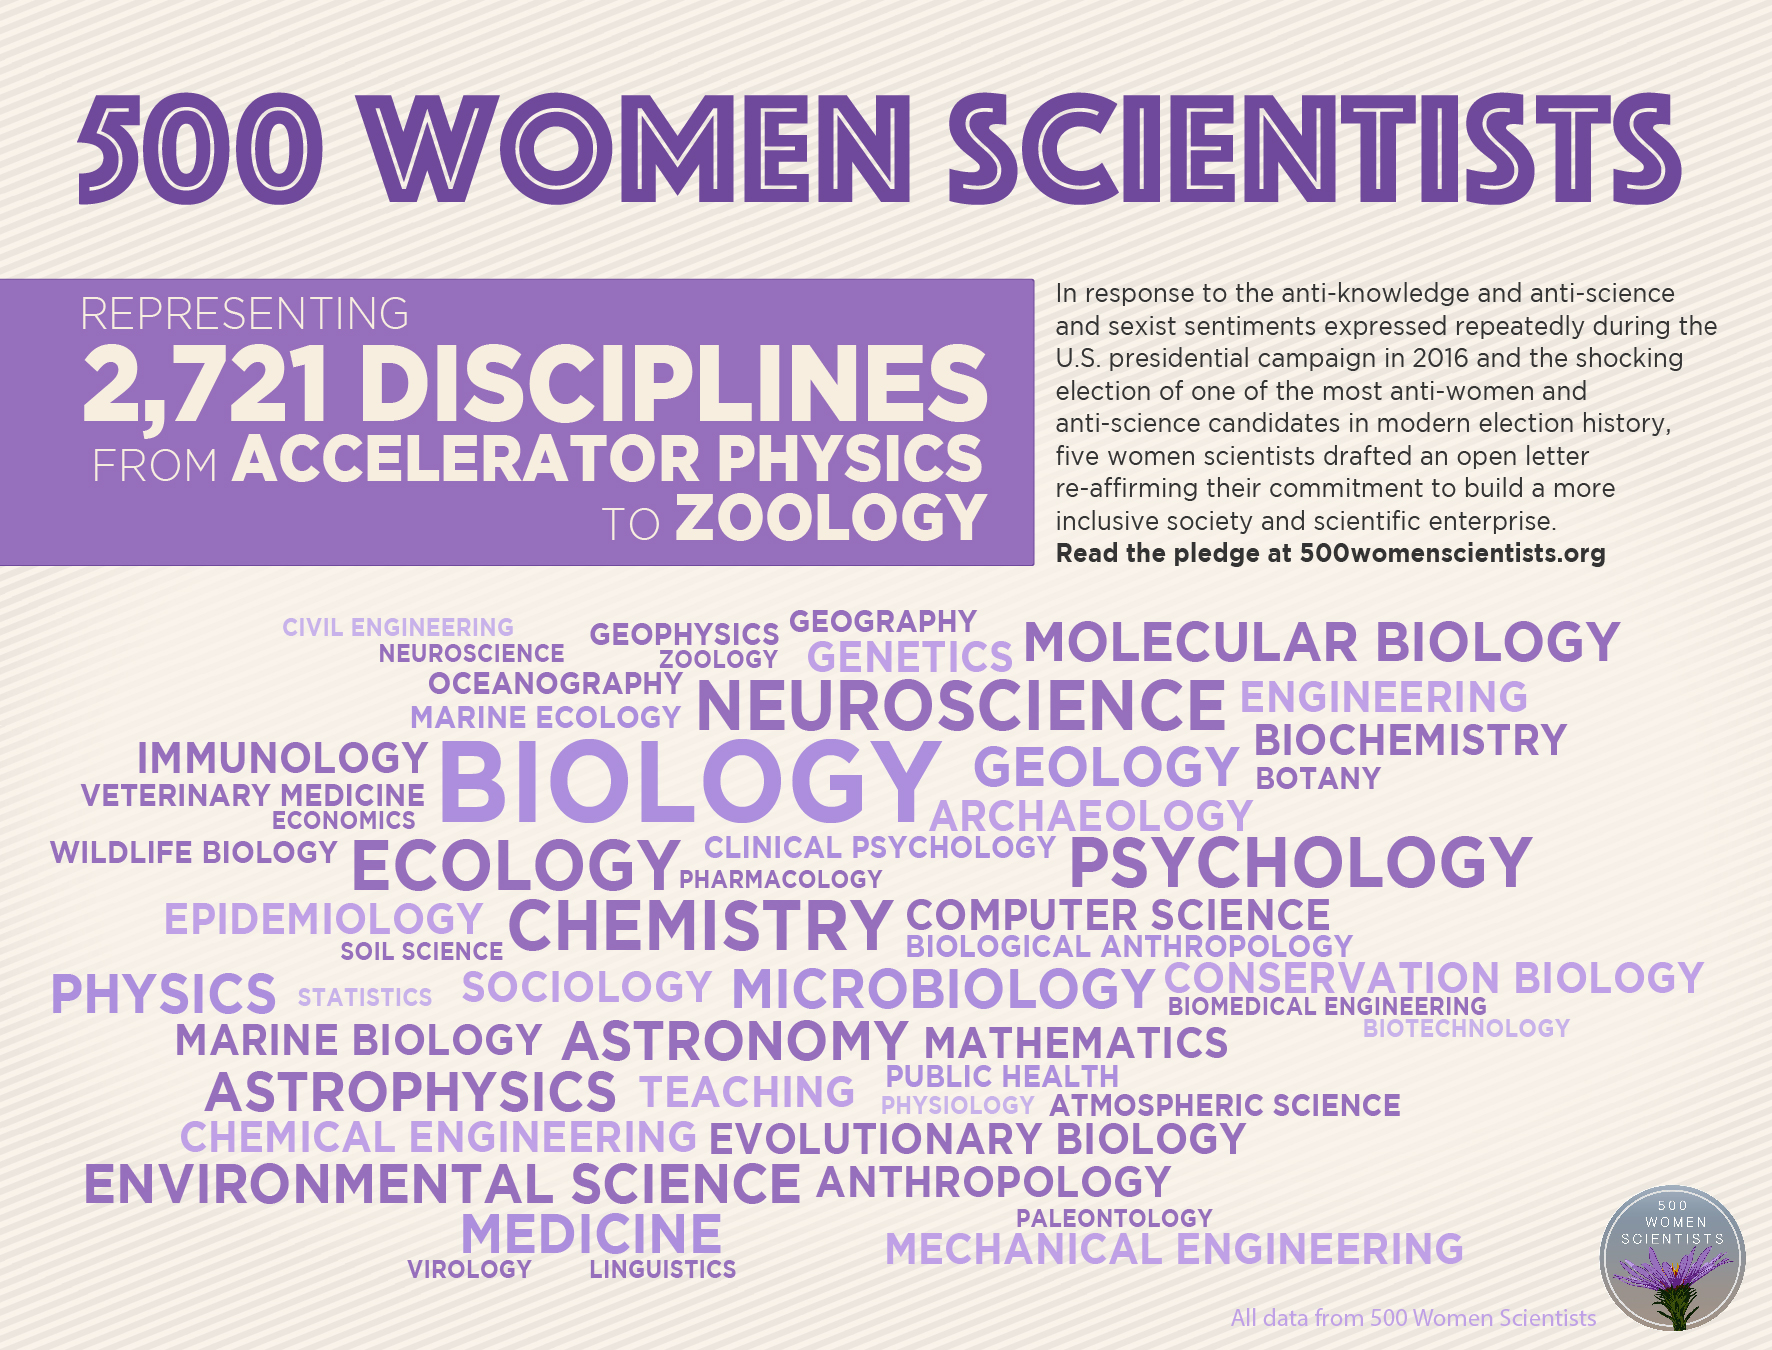
500 Women Scientists infographic (disciplines detail) 
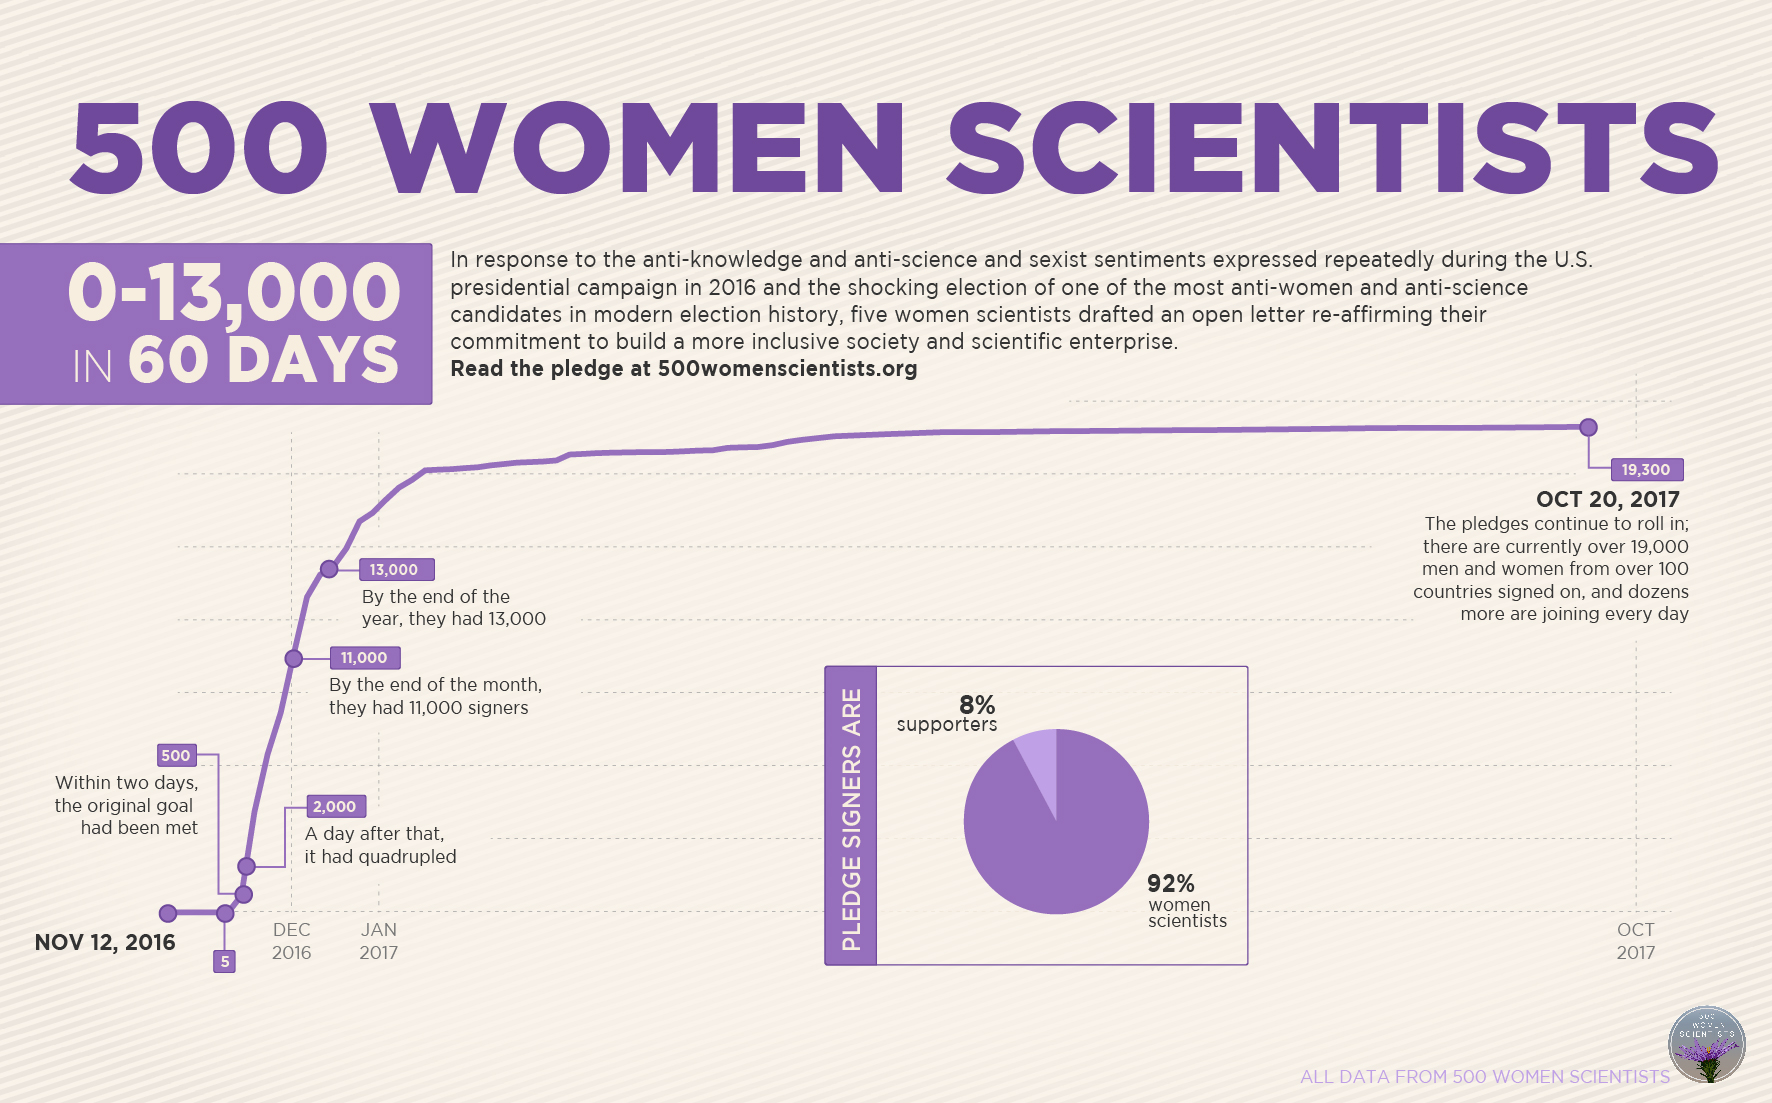
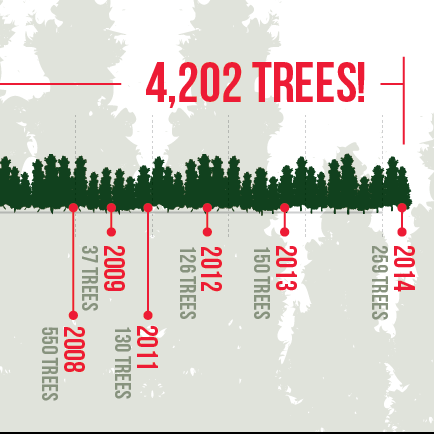
500 Women Scientists infographic (growth detail) 
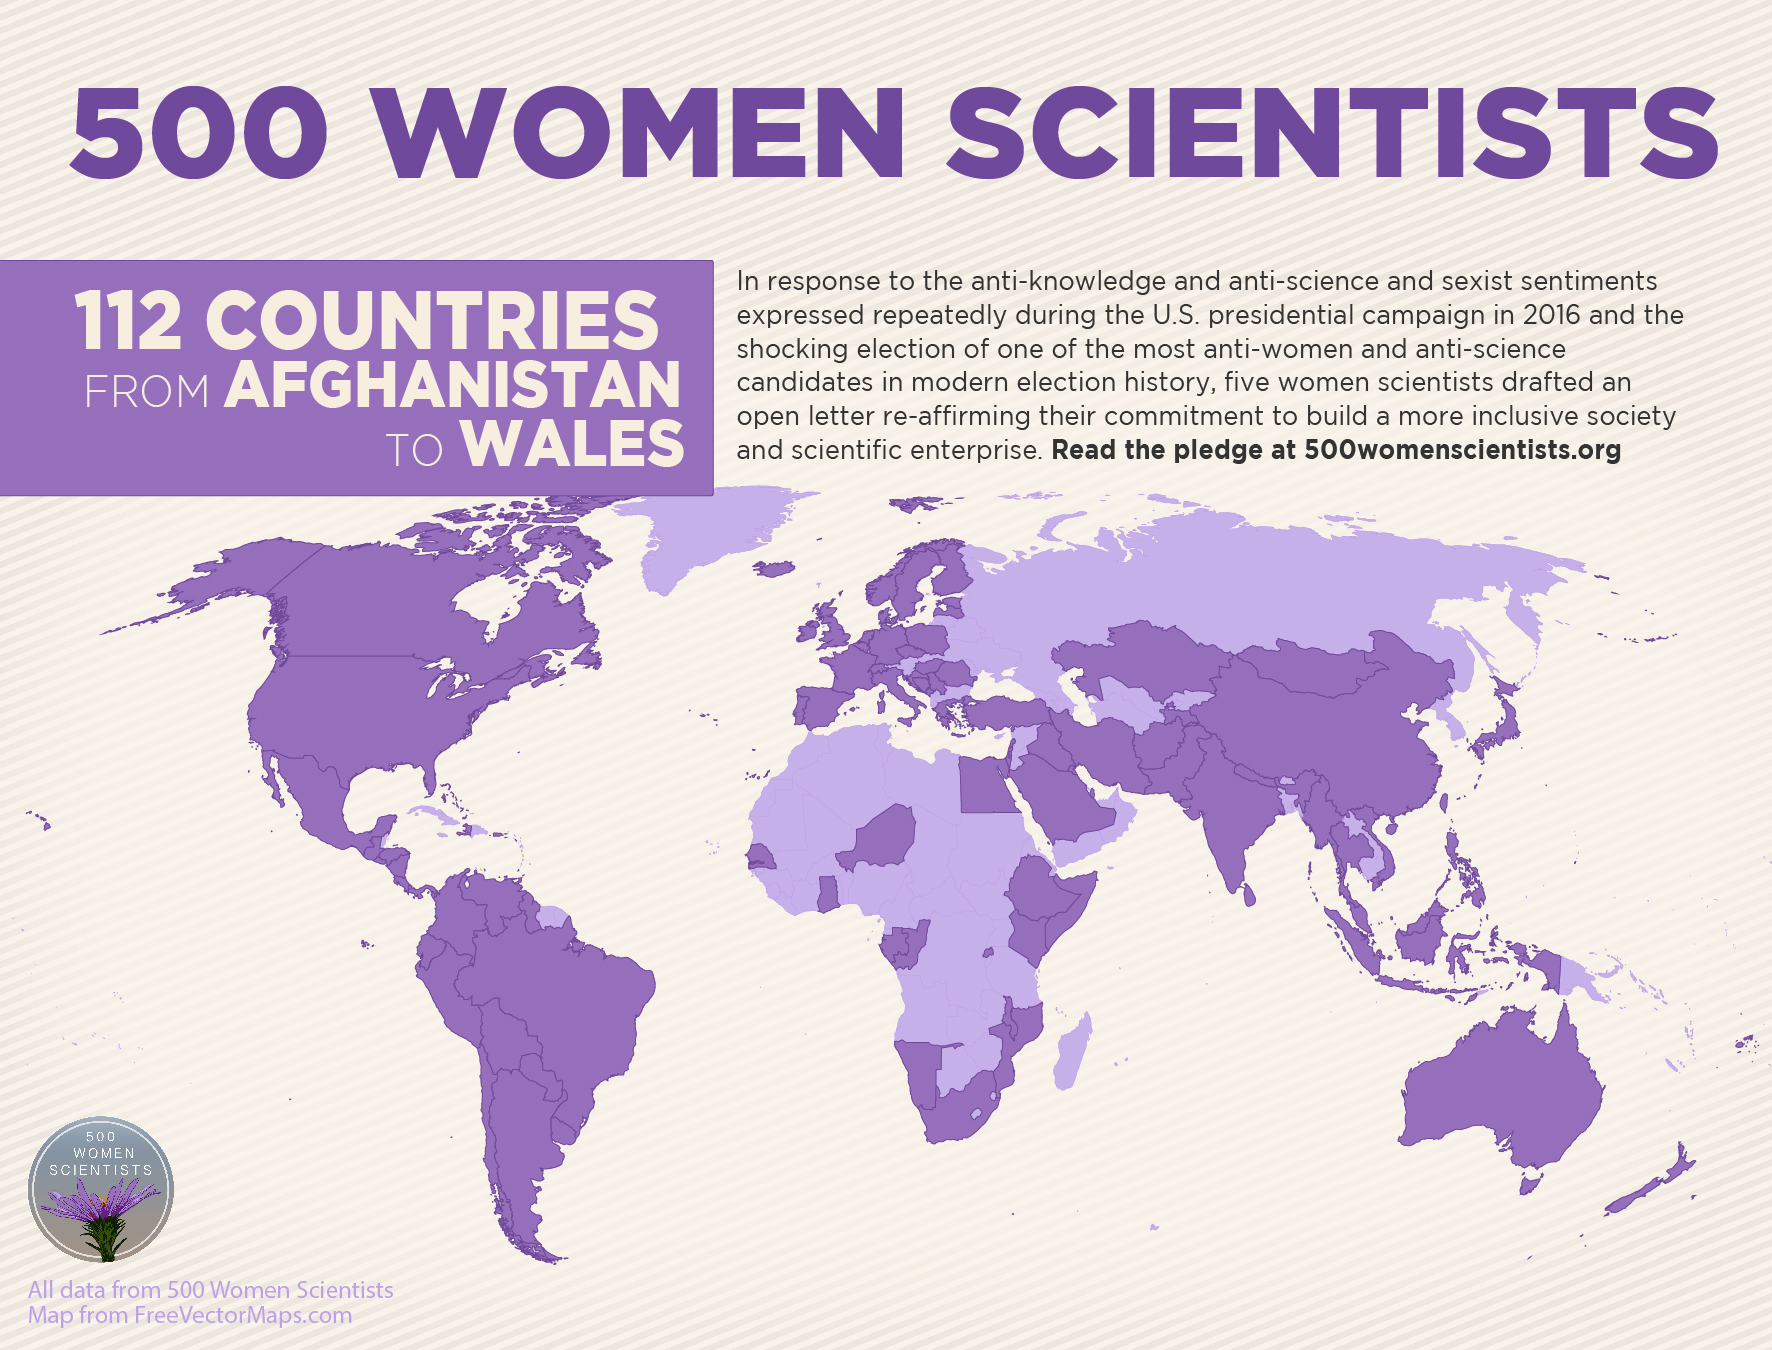
500 Women Scientists infographic (country detail) Client: 500 Women Scientists Date: January 2017 See other infographic examples Impact on Education infographicOctober 15, 2019 CU Budget InfographicsJune 29, 2018 Campaign reporting dashboardsOctober 17, 2017 500 Scientists InfographicJanuary 27, 2017 Let Colorado Vote Campaign Reporting InfographicsNovember 23, 2016 1A for DIA infographicOctober 27, 2015 Lifecycle of craft beer infographicAugust 23, 2015 Anheuser-Busch Tree-planting event bannerMay 23, 2014 OnSight End-of-Year InfographicDecember 23, 2013 Yes on Amendment 66 infographicsAugust 23, 2013 Pedal The Plains infographicOctober 23, 2012